

Import and combine data
Upload CSV files and Excel files, connect Google Sheets, or connect other data sources, then combine data in a few clicks. This is aimed at removing manual copy-paste and VLOOKUP-style work.

DataSquirrel.ai is a web-based AI data analysis platform for non-technical business users. It helps teams clean, analyze, visualize, and share spreadsheet and connected data without formulas, pivot tables, SQL, or coding.
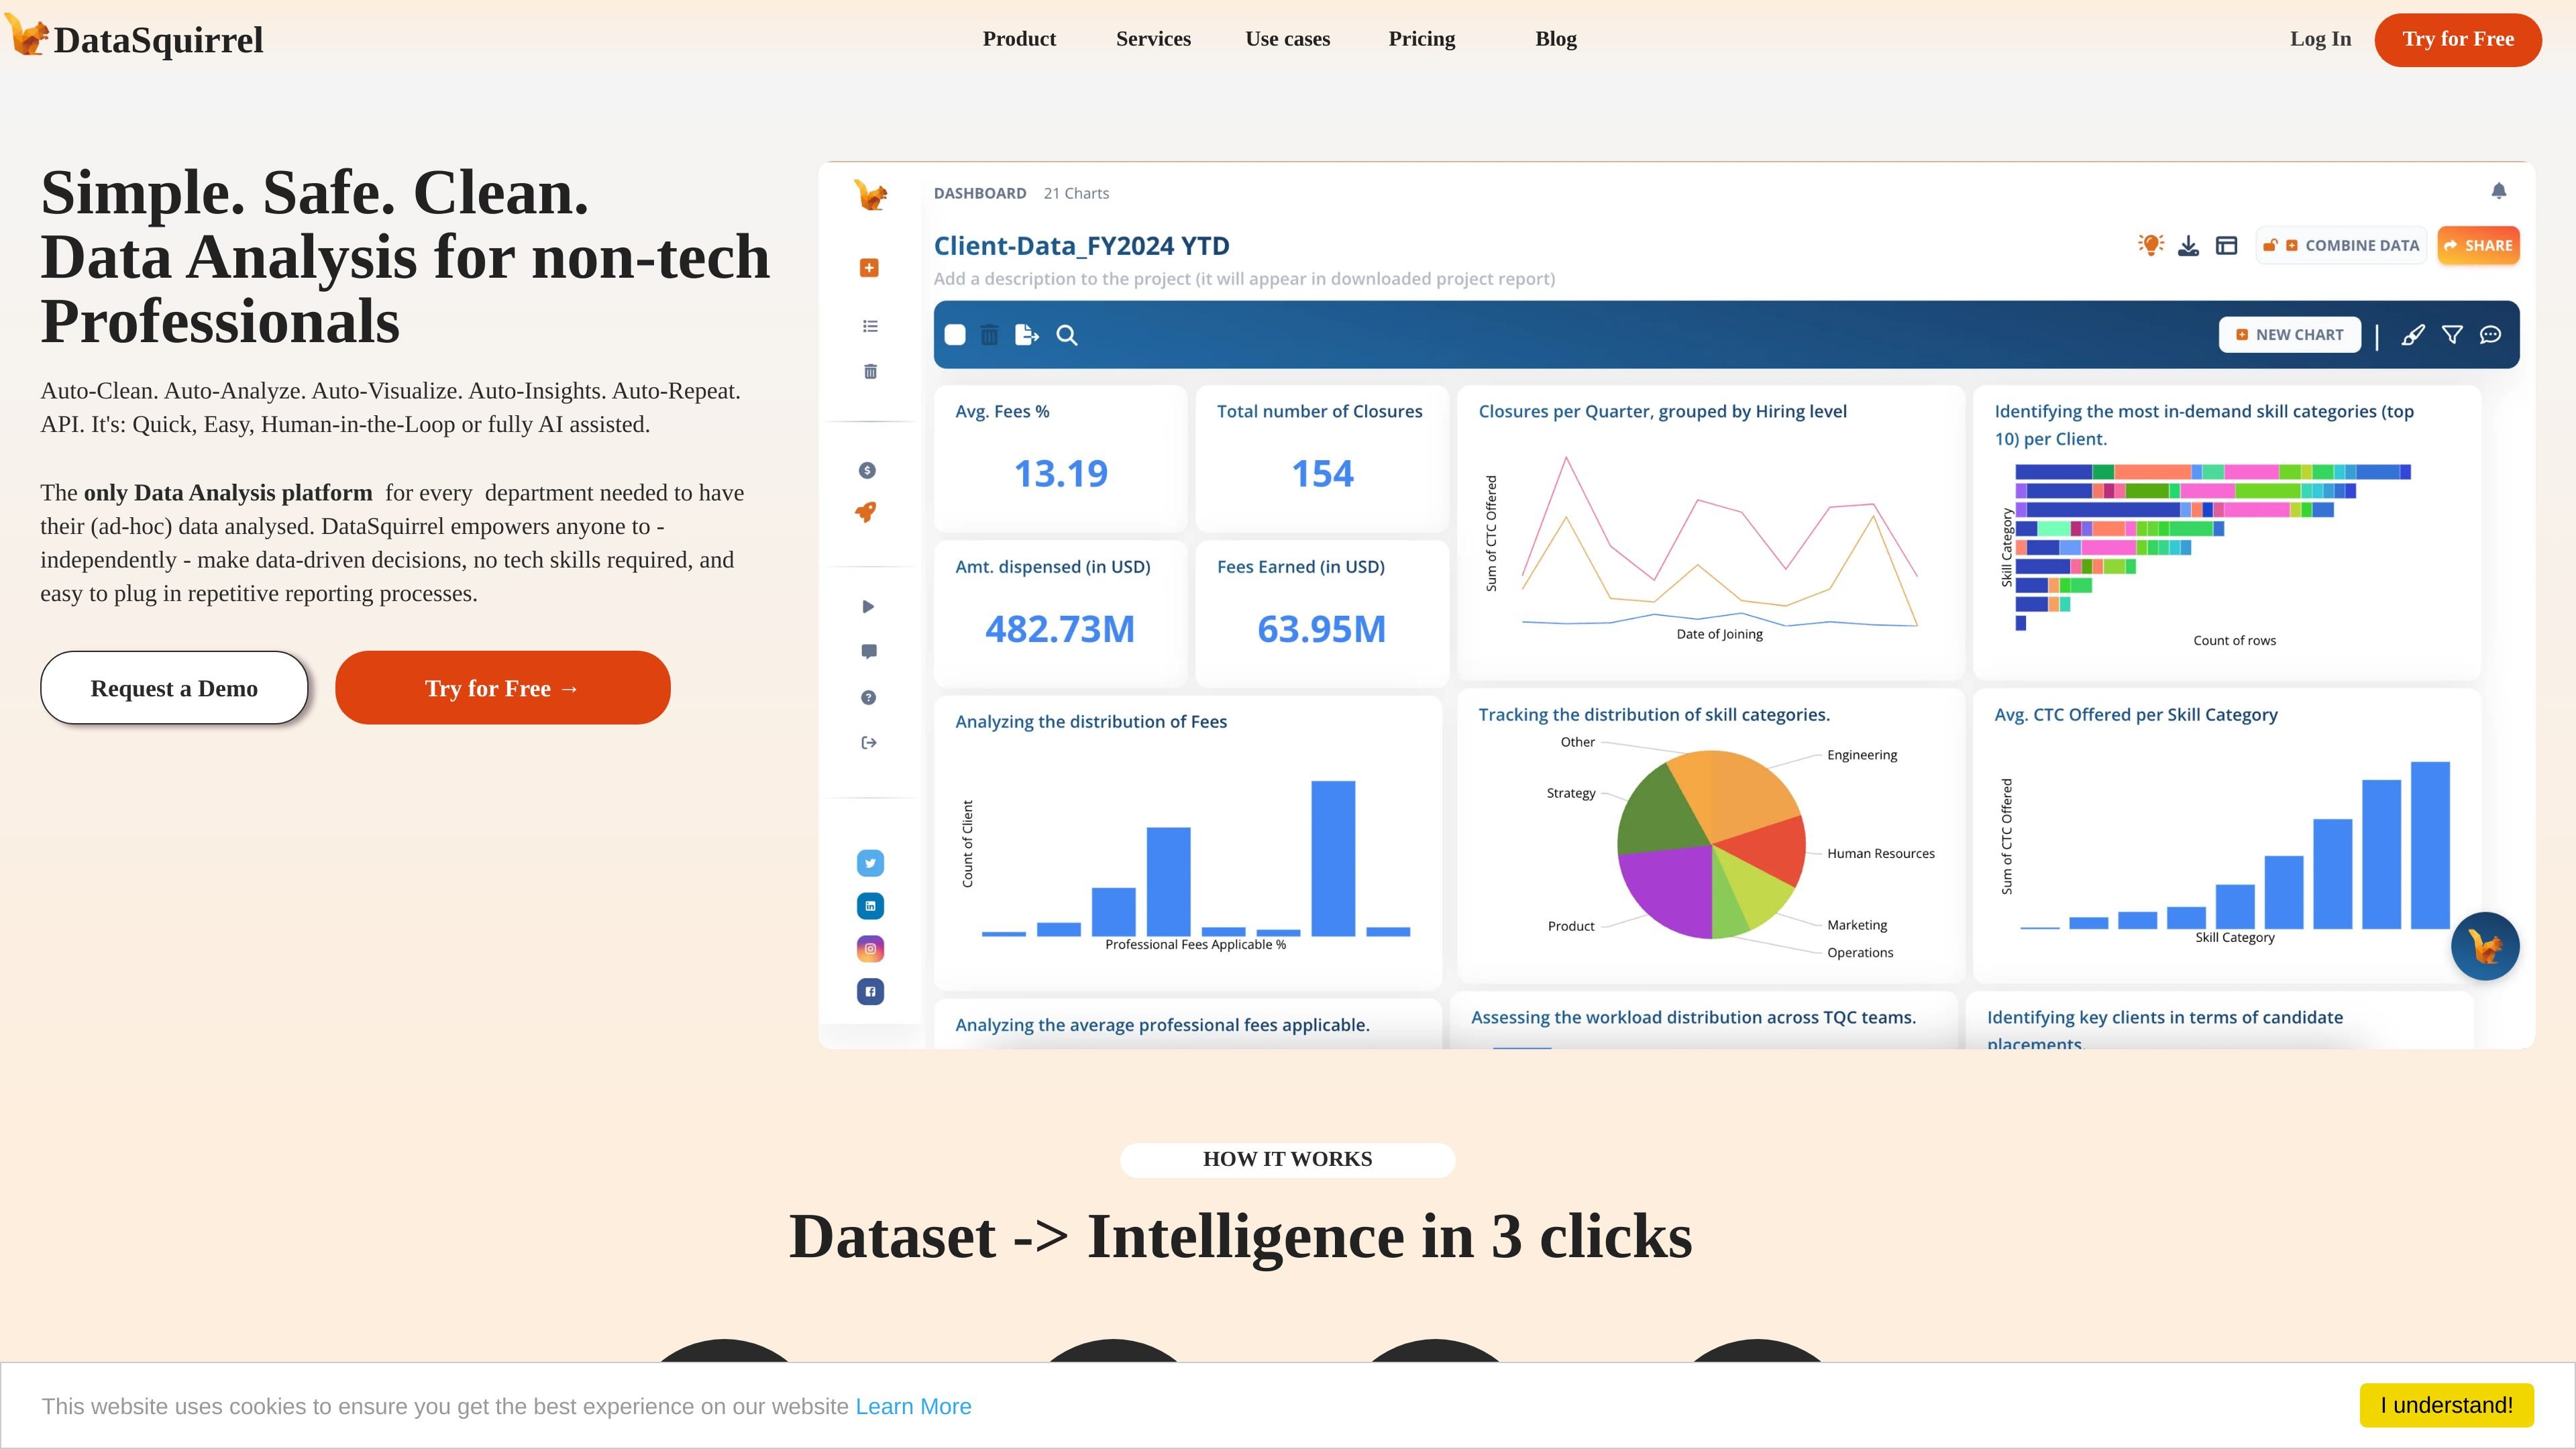
DataSquirrel.ai is an AI-assisted data analysis platform for non-technical business users. It is built to help people upload, connect, clean, analyze, visualize, and share data without needing formulas, pivot tables, SQL, or coding.
The product centers on a guided workflow that turns spreadsheets and other business data into cleaned datasets, charts, dashboards, and reports. The site positions it for management, teams, and consultants who need fast analysis, collaboration, and repeatable reporting from ad hoc or recurring data work.
Upload CSV files and Excel files, connect Google Sheets, or connect other data sources, then combine data in a few clicks. This is aimed at removing manual copy-paste and VLOOKUP-style work.
DataSquirrel identifies common issues such as duplicates, inconsistent formats, missing values, casing problems, and white space, then suggests or executes cleaning actions before analysis.
The product can generate analysis outputs automatically, and the site highlights one-click analysis, auto-insights, and guided workflows that return key metrics and charts from the dataset.
Users can customize views with filters, segmentation, date and number grouping, themes, and other chart adjustments to shape reports for different audiences.
Charts, dashboards, and reports can be shared by link or email, commented on in-app, and exported in formats such as PNG, PDF, and PPT according to the source pages.
The pricing page lists scheduled data recalculations and recurring report distribution, which supports repeat analysis and reporting on updated data.
A manager can upload operational spreadsheets, let the system clean and summarize the data, and quickly review charts or dashboards for ad hoc decision-making.
Teams can combine messy Excel and CSV files, run root-cause analysis, and share annotated visuals so stakeholders can review findings together.
Consultants can merge data from multiple client sources, produce client-ready reports, and reuse the same workflow when similar requests come in again.
Departments with recurring reporting needs can schedule recalculations and automated distribution so updated data is processed in the same way each cycle.
Users handling sensitive business information can anonymize data before sharing or analysis, reducing exposure when working with confidential datasets.
DataSquirrel is designed to work with CSV files, Excel files, Google Sheets, and connected data sources. The source also mentions API-based connectivity for some plans.
Yes. The product describes support for sharing interactive visuals by link or email, leaving comments on charts, and scheduling recurring data refreshes and report distribution.
The product emphasizes a guided workflow with auto-cleaning, auto-analysis, and customizable visuals. It is positioned for non-technical business users who do not want to work with formulas, pivot tables, SQL, or coding.
The source says DataSquirrel does not send raw data to ChatGPT or other large language models. It also states that sensitive data can be anonymized by default and that the platform is positioned around GDPR/PDPA compliance.
Pricing is offered as monthly plans with a free tier shown on the pricing page, plus Lite and Pro subscription plans. The page also mentions one-time limited-feature access and separate sales follow-up for integrations and team plans.

北极九章 is an enterprise AI data insight engine for natural-language data analysis. Ask by typing or voice and get charted results in workflows.
Tableau is a business intelligence and visual analytics platform that helps people explore data, create visualizations, and share insights. It offers hosted, self-managed, and desktop options for teams that need analytics, governance, and collaboration.

Hurree is an AI-powered reporting and analytics platform that centralizes company data, shared dashboards, and Riva summaries, recommendations, and forecasts.

Postfity is a social media management tool for scheduling, planning, publishing, and tracking posts across connected accounts. Includes analytics, inbox management, AI tools, team workflows, and Free and paid plans.

AnyClip is a visual intelligence platform for video that automates enrichment, improves discovery, and supports engagement and monetization.

Arcwise is an AI product for detecting meaningful metric changes and explaining them with data-grounded analysis. It turns warehouse and business-context data into decision-ready reports in app, docs, or slides.