

Data Recognition and Validation
The product emphasizes built-in data structure recognition and validation to automatically avoid common errors and logic conflicts, helping reduce issues such as AI-generated fake data or chart misalignment.
爱图表 is an AI-powered visual content platform for generating and deeply editing charts, infographics, and report visuals.
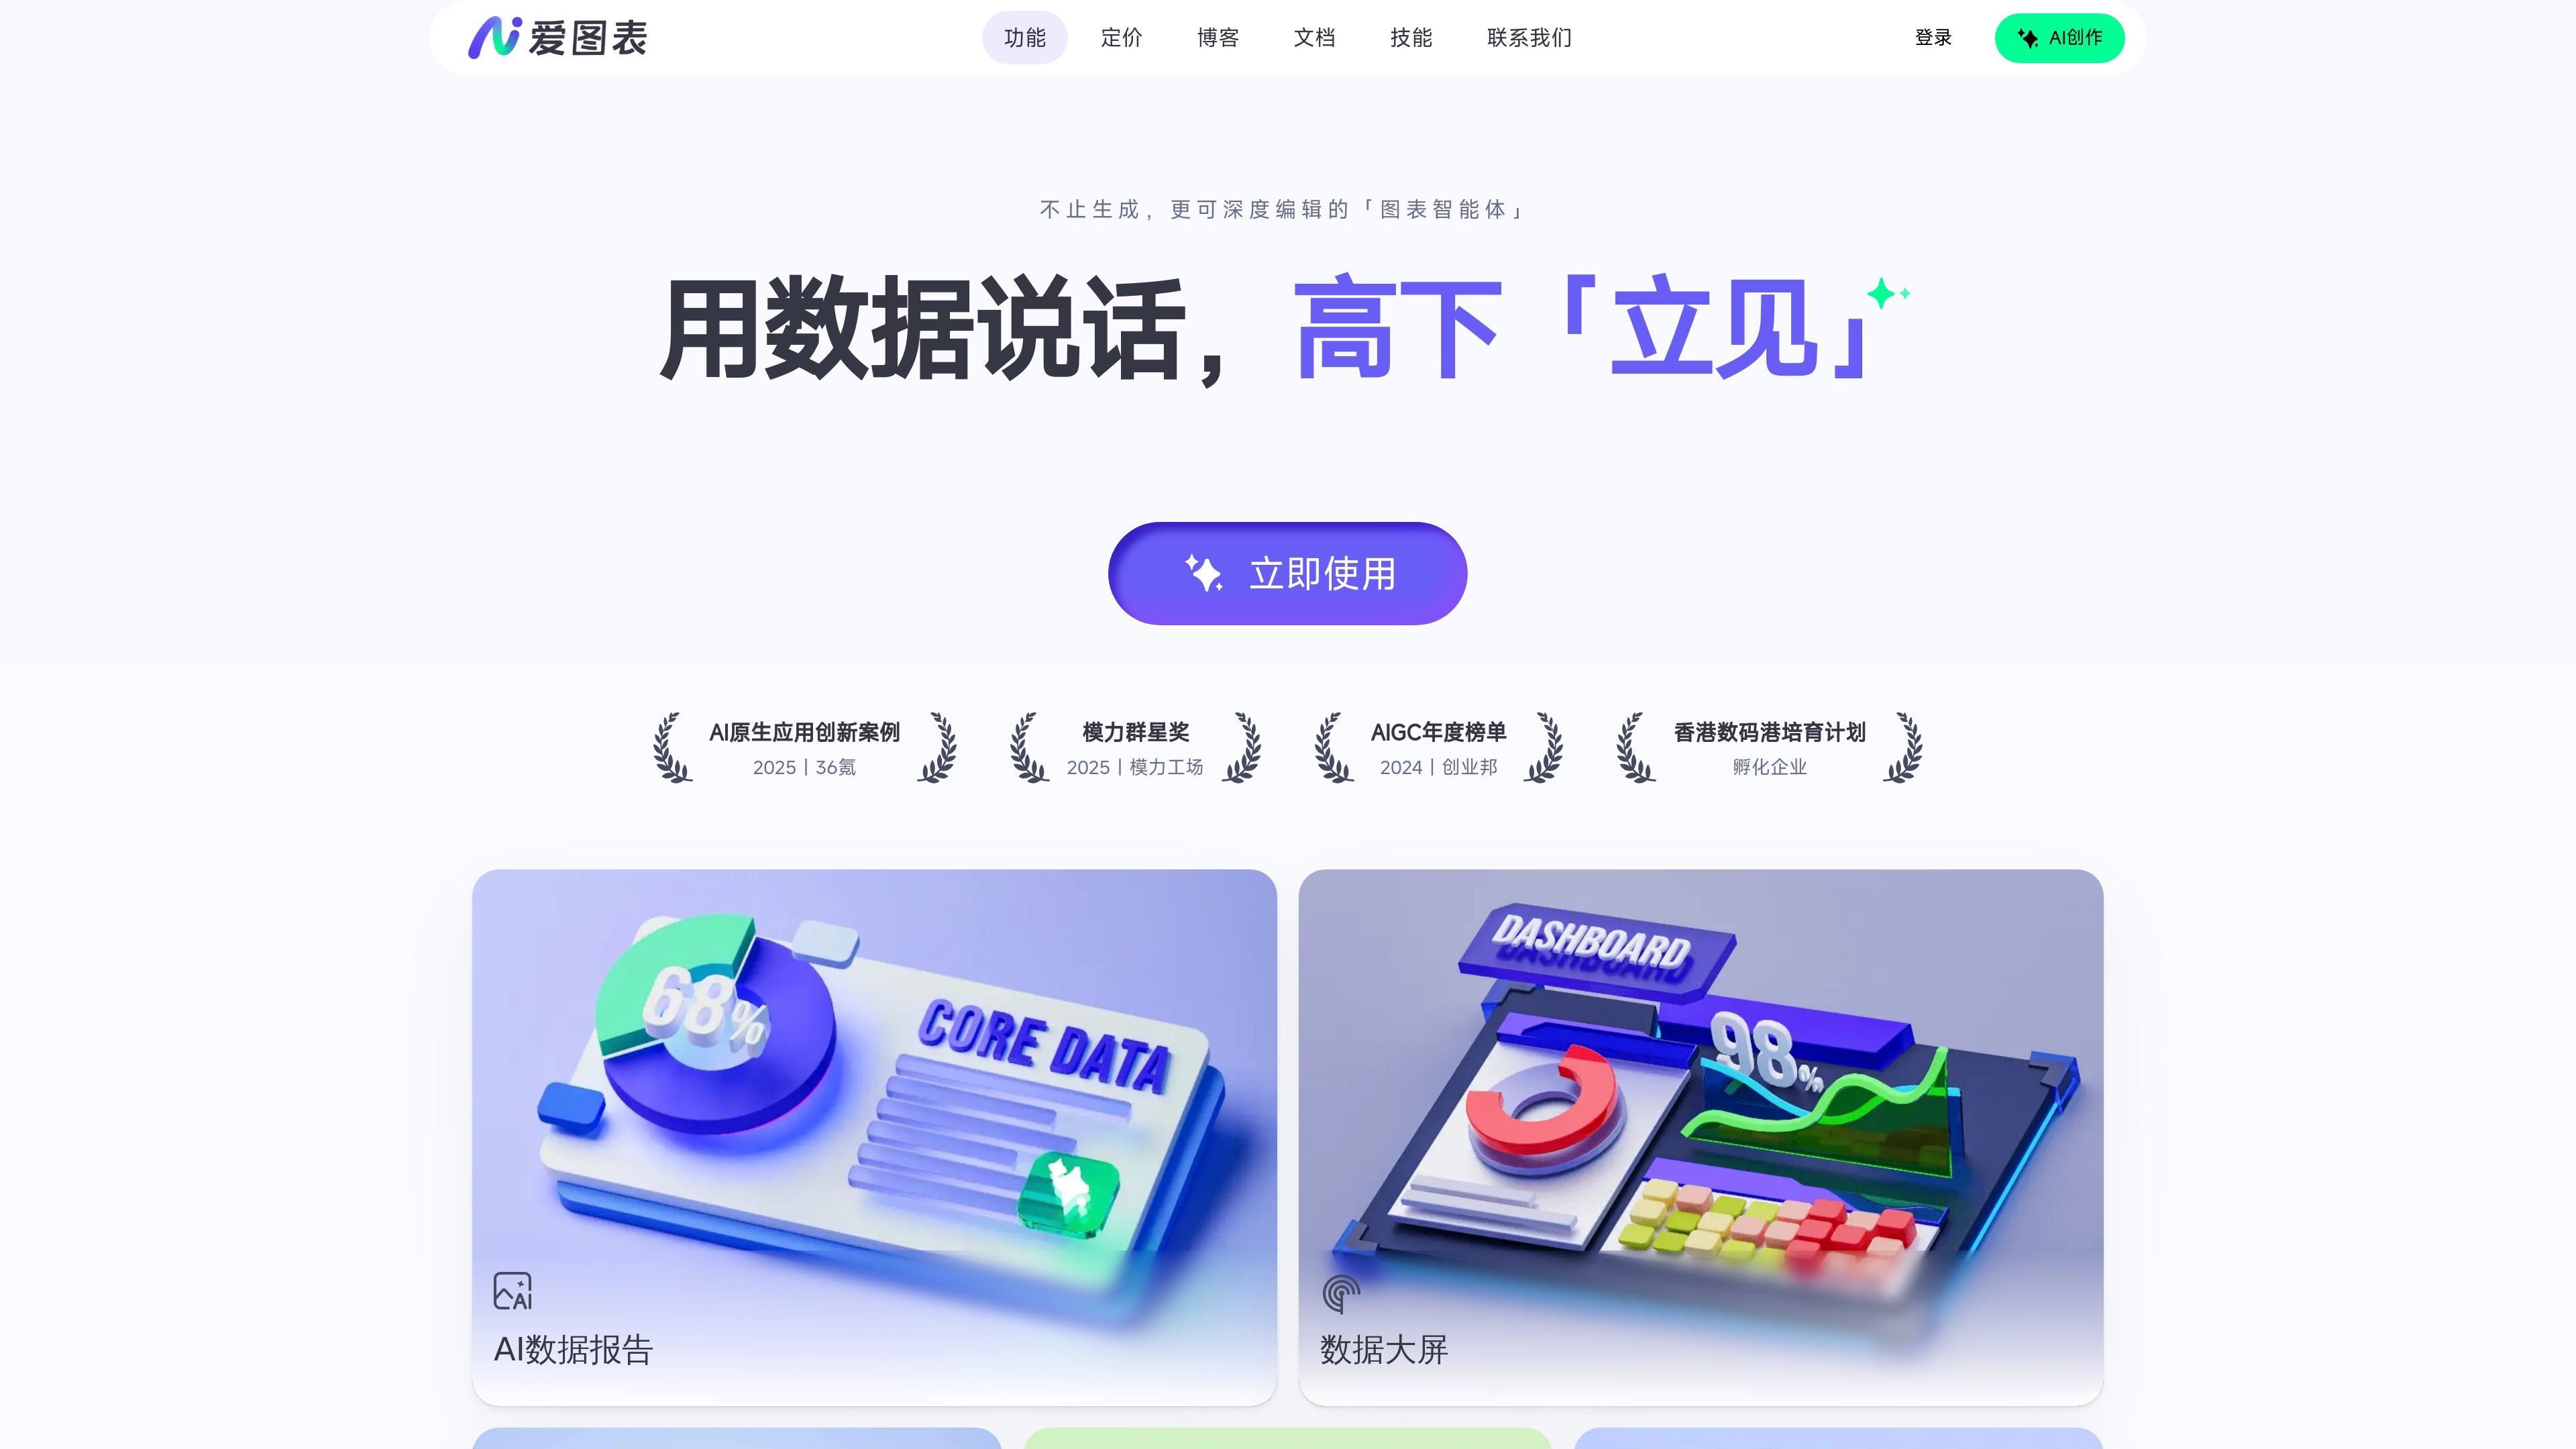
Aitubiao is an AI-driven visual content creation platform positioned as a “chart agent that does more than generate — it also supports deep editing.” It is aimed at users who need to turn data, documents, and presentation materials into charts or visual expressions, with emphasis not only on automatic generation but also on follow-up editing and adjustment.
From the homepage and skills pages, the product is built around three directions: data accuracy, professional presentation, and controllable results. It provides data structure recognition and validation, automatically completes chart selection and layout design, extracts key information from complex data and documents, and allows users to revise the generated content multiple times. The documentation center further provides onboarding guides, FAQs, and usage instructions to help users get started by scenario.
In actual use, Aitubiao also offers Skills for reporting, review, presentation, and communication scenarios, with examples including generating multiple related charts, generating data reports, Sankey diagrams, and 3D charts. The Enterprise page shows that it also supports organizational customers with higher concurrency, API access, localized/private deployment, permission management, and custom development.
The product emphasizes built-in data structure recognition and validation to automatically avoid common errors and logic conflicts, helping reduce issues such as AI-generated fake data or chart misalignment.
The system automatically handles chart selection, information layout, and visual design conventions, so even users unfamiliar with chart creation can get more complete results.
The product can parse complex data and document content, extract key conclusions and core information, and is well suited for turning raw materials into presentation-ready content.
The homepage explicitly states that all content can be edited and adjusted, with support for multiple rounds of modification and fine control, so generation is not the end point.
The pricing page lists standard-plan support for exporting all formats including SVG, custom scale exports, and watermark removal, indicating further output and distribution processing.
The skills page provides directly installable Skills covering workflows such as generating multiple charts, generating data reports, Sankey diagrams, and 3D charts.
Suitable for scenarios where raw spreadsheets, data reports, or multiple materials need to be organized into content that can be presented directly; the system automatically extracts key points and structures the expression.
Suitable for work such as event retrospectives, campaign analysis, and media distribution analysis; users can quickly generate multiple charts or data reports through Skills, reducing repetitive work.
Suitable for paper organization, research presentations, coursework, and defense presentations; the documentation center and skill workflows help turn materials into clearer visual content.
Suitable for government, media, state-owned enterprises, and other organizational customers who need higher concurrency, API access, private deployment, and permission management through the Enterprise version.
Suitable for users who want to represent flows, intersections, or more spatial chart styles, such as Sankey diagrams and 3D charts.
Aitubiao offers plans ranging from a free version to Standard, Premium, and Enterprise. The free version is suited for basic trial use, paid versions provide more AI credits, templates, export options, and storage, while the Enterprise version supports customization and integration services as needed.
The documentation center lists quick creation of infographic content, AI chart generation, the AI editing experience, project management, account management, chart usage guides, chart knowledge notes, chart examples, and FAQs, making it a good place to learn before getting started.
From the homepage and the skill pages, Aitubiao supports deep editing after chart generation and allows multiple rounds of modification and fine-grained control over the content.
The skill pages provide installable skills for reporting, review, presentation, and distribution scenarios, with examples including generating multiple charts, generating data reports, Sankey diagrams, and 3D charts.
The Enterprise page states support for API access, localized/private deployment, team permission management, exclusive templates and brand customization, as well as training, implementation, and project delivery.

GraphicInfo is a web-based AI infographic maker that turns text or ideas into visuals in one click for faster, shareable infographics.

Paper is a design tool that connects canvas, code, and AI agents so teams can create, share, and ship work in one workflow. Includes desktop app and MCP access.

Superside is an AI-powered creative service for enterprise and in-house teams, with global talent, AI-first workflows, and subscription-based support.
ChartAI is a web-based AI tool for charts, diagrams, infographics, and visuals for presentations, papers, and projects.

HaiSnap is an AI office and creation tool that turns natural language into PPTs, reports, data analysis, code and content drafts.

SlideSpeak is an AI presentation maker that turns prompts and source files into editable PowerPoint decks. It also redesigns slides, translates, summarizes, and supports branding and video presentations.