

Offline HTML bug reports
Records the user journey into one self-contained .html file so the report can be opened offline and shared like a normal file, not a hosted ticket.

TraceBug is a local-first bug reporting tool that turns browser issues into a self-contained .html report for offline developer hand-off, with local MCP debugging and export options.
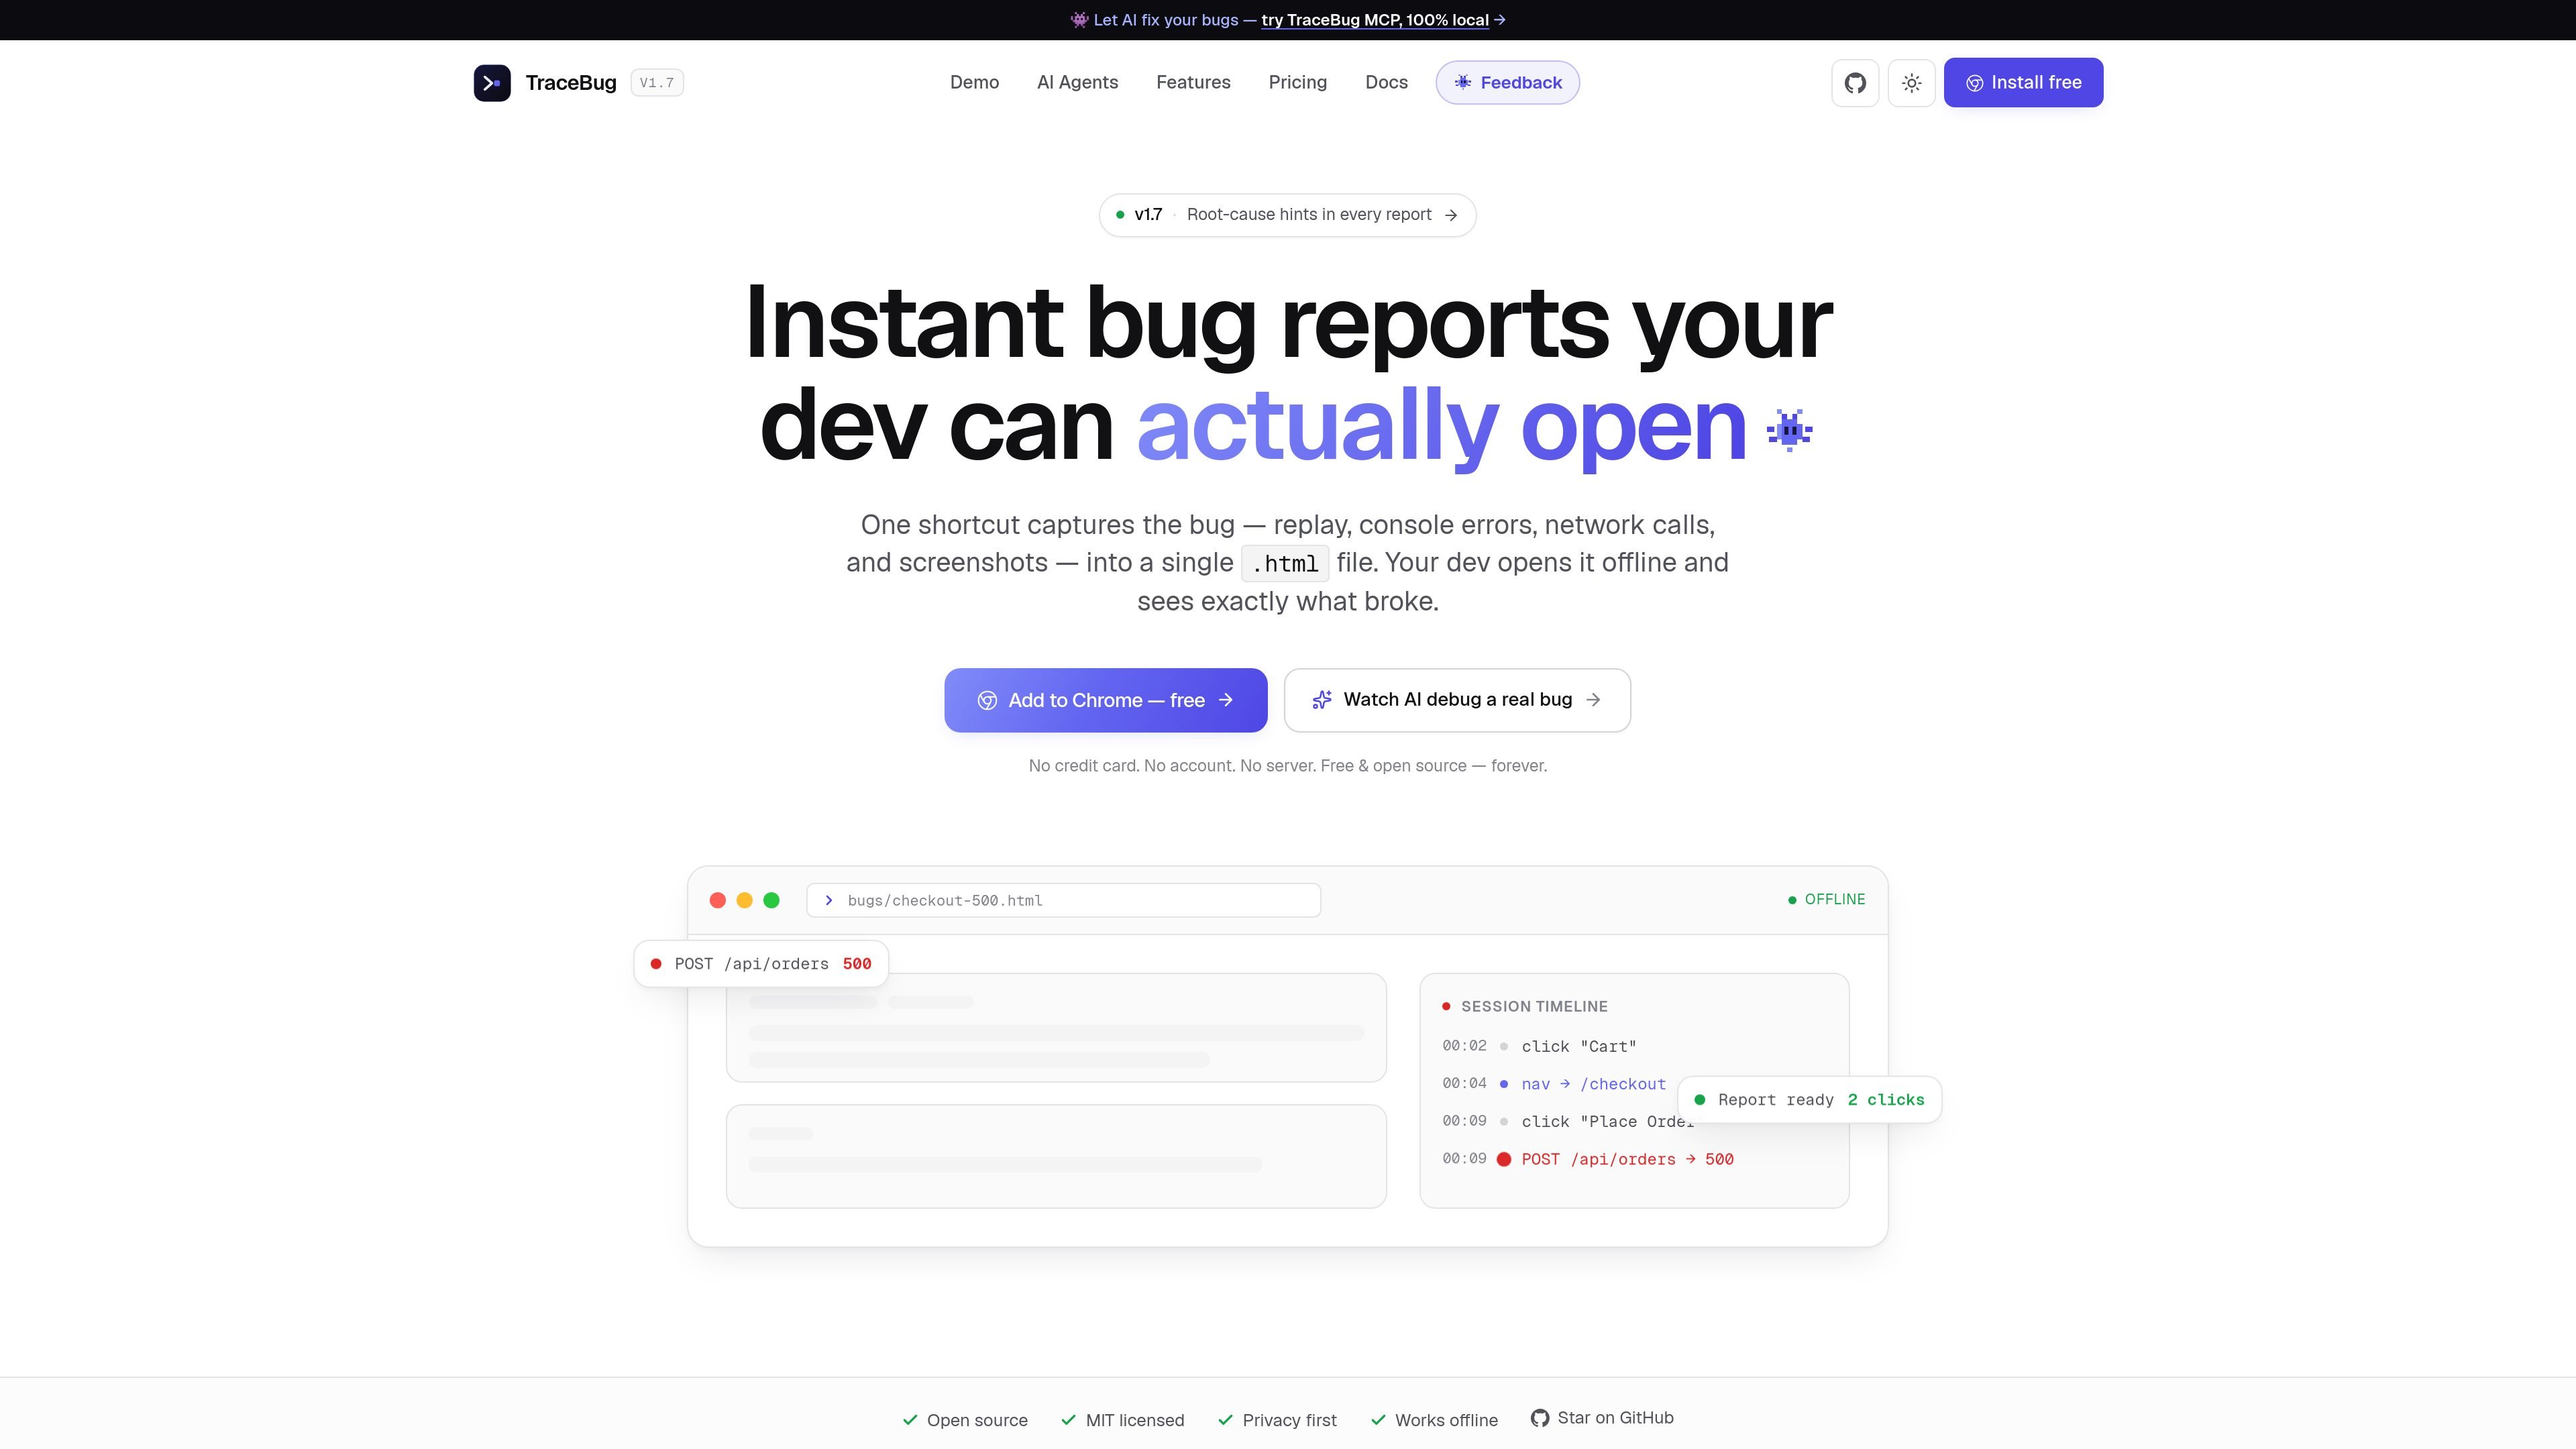
TraceBug is a local-first bug reporting tool that packages a user’s session into a single .html report. The report can include replay, console errors, network requests, screenshots, and captured steps so a developer can open it offline and see what happened.
The product is aimed at the hand-off from tester to developer. Instead of asking someone to retype reproduction steps or paste screenshots into a form, TraceBug turns the bug into a file that can be sent directly, exported into ticket formats, or read by an AI coding agent through its local MCP server.
Records the user journey into one self-contained .html file so the report can be opened offline and shared like a normal file, not a hosted ticket.
Captures the session replay together with console errors, network requests, screenshots, and the user actions that led to the bug.
Adds a root-cause hint at the top of the report, helping the developer see the likely failing request or exception before scrolling through the trace.
Provides export paths for GitHub issue, Jira ticket, PDF, and JSON, so the same capture can be adapted to different hand-off workflows.
Ships with a local MCP server that lets Claude Code, Cursor, Windsurf, VS Code, or another MCP client read reports from disk and investigate them.
Offers a Chrome extension and npm SDK for capture, with offline local bug handling available before any paid collaboration features.
A tester hits a bug in the browser, captures it with one shortcut, and sends the exported file to a developer without filling out a long form.
A developer opens the exported .html report offline to inspect the replay, console error, failed request, and screenshots before starting a fix.
An engineering team uses the local MCP server so Claude Code, Cursor, Windsurf, or VS Code can read a report from disk and investigate the likely cause.
A team that prefers issue trackers exports the same capture into GitHub issue, Jira ticket, PDF, or JSON formats instead of keeping it as a browser file.
A product or support team captures a recurring bug locally first, then decides later whether to use cloud sharing or future team plans for collaboration.
TraceBug captures a bug as a self-contained .html report. The report includes session replay, console errors, network activity, screenshots, and root-cause hints, so the developer can open it offline without needing an account or upload flow.
The browser extension and local capture flow are presented as free. The pricing page says local bug capture and offline .html exports are free forever, while paid plans are reserved for collaboration features such as shareable URLs, integrations, and self-hosting when those are needed.
TraceBug’s MCP server runs locally over stdio. The docs say you can point an MCP client such as Claude Code, Cursor, Windsurf, or VS Code at a folder of exported reports so an agent can read the report from disk and debug against your codebase.
The source pages show exports for GitHub issues, Jira tickets, PDF, and JSON, plus Slack and Linear mentioned in the pricing page. The MCP docs also describe a local hand-off workflow for sending the exported .html file to a developer or agent.
The site describes a free local-first product, plus coming-soon paid plans for Pro, Team, and Enterprise. Pro adds cloud sharing and branding features, Team adds shared workspaces and auto-sync, and Enterprise adds self-hosting and compliance-oriented controls.
Les données de trafic sont fournies à titre indicatif uniquement.
Les analyses de trafic ne sont pas encore disponibles.

Trunk is a CI reliability platform for detecting flaky tests, quarantining failures, and managing merge queues in GitHub workflows. Free and paid plans available.

BotLab is a tool for testing video-game bots by running them in simulated game clients, reviewing session logs, and comparing results in the Reactor. It offers a free tier for short sessions and a paid Pro plan for longer online runs.

Codesphere is a virtual cloud platform for development, deployment and operations across on-prem, cloud and hybrid infrastructure, with portability and security.

AppVision is a boutique app studio for iOS and Android, offering design, development, and growth with weekly releases and data-driven iteration.
Intract is a cross-border payments platform for businesses, with real-time settlement, multi-currency support, compliance handling, and transparent rates.

Newfront is a business insurance brokerage and software platform for commercial insurance, employee benefits, and retirement services.