

Trade analytics and dashboards
Analyze trade history with 600+ statistics, interactive charts, pivot tables, and customizable dashboards designed to surface patterns in performance and mistakes.

TradesViz is a web-based trading journal and analytics platform for importing executions, reviewing performance, and organizing workflows across asset classes.
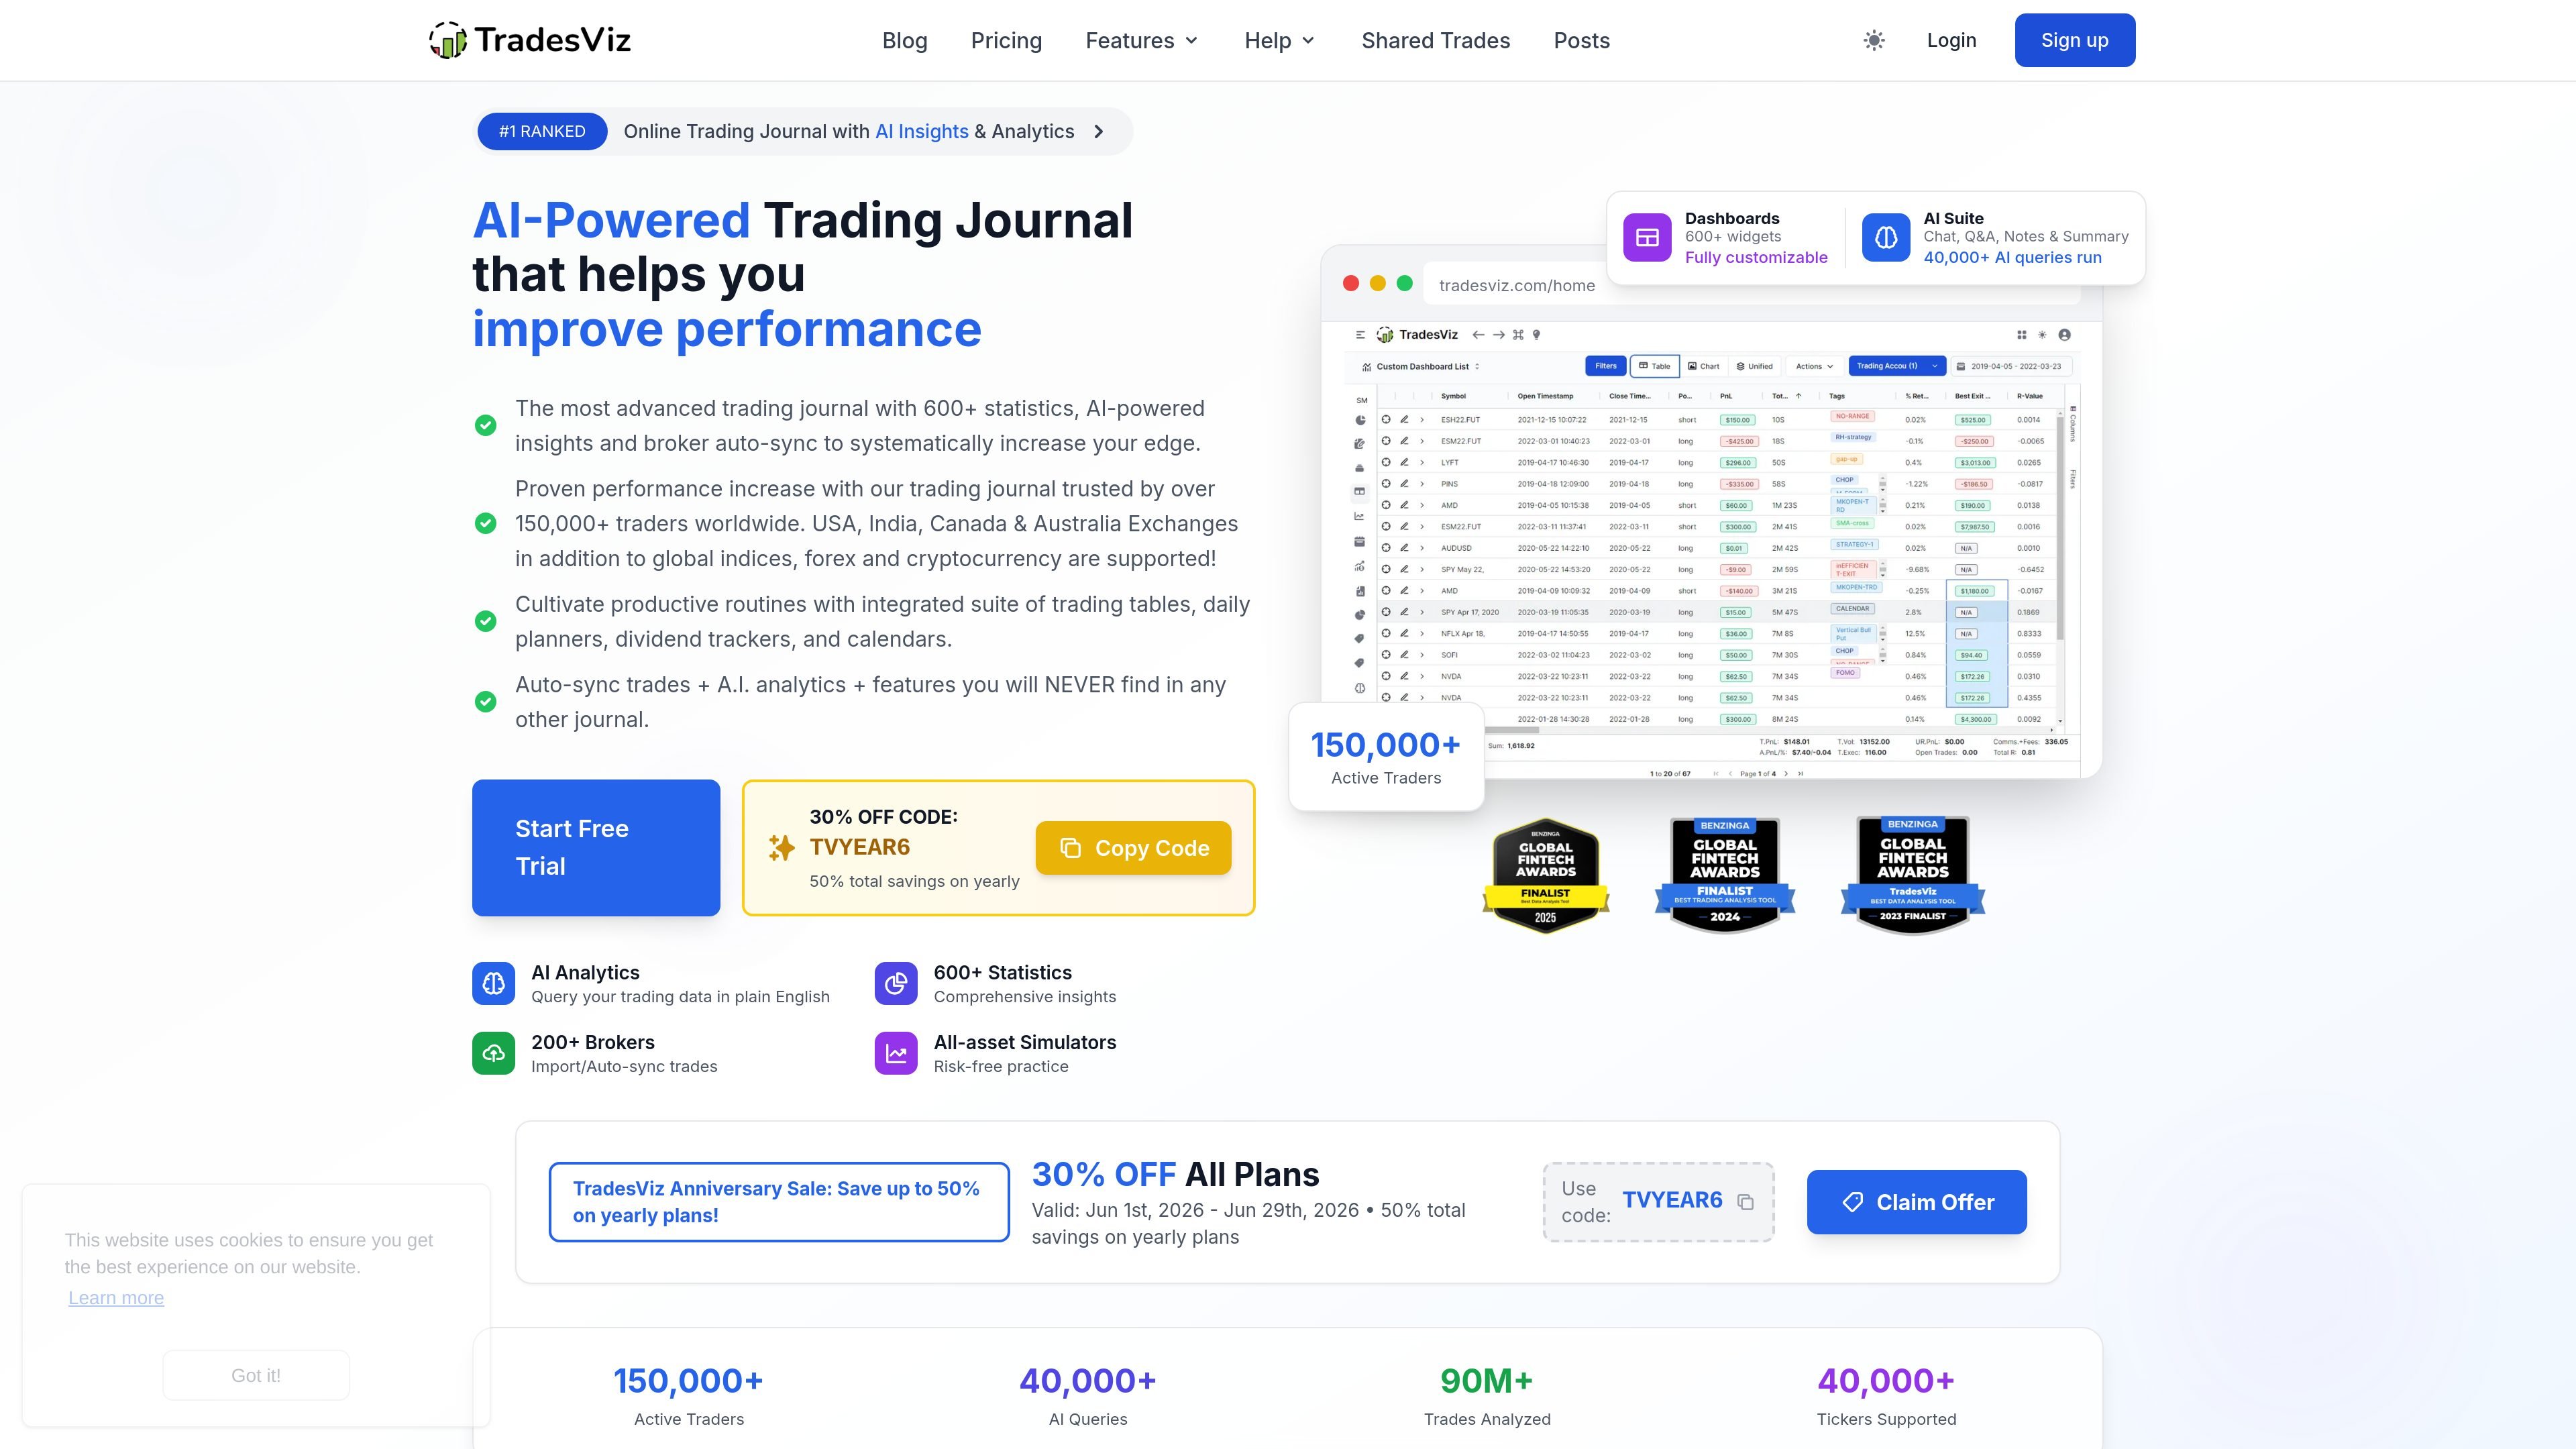
TradesViz is an online trading journal and analytics platform for traders who want to record executions, analyze performance, and organize trading decisions in one place. The site presents it as an AI-powered journal with trade import, broker auto-sync, simulation, charting, and dashboard tools across stocks, futures, forex, options, crypto, and related markets.
Its main purpose is to help traders review what they did, identify recurring mistakes, and build a repeatable workflow from the same data. The platform emphasizes statistical analysis, customizable views, and multiple ways to bring trades in, including file imports, synchronization with supported brokers, and manual entry.
Analyze trade history with 600+ statistics, interactive charts, pivot tables, and customizable dashboards designed to surface patterns in performance and mistakes.
Query trading data in plain English and turn answers into dashboard widgets or analysis outputs using the AI Q&A tools.
Import trades from broker files, broker sync, or manual entry, with account selection, timezone, and currency controls during setup.
Track trades visually with calendar views, tables, notes, planners, goals, and day-level analysis so journal data is organized around the trading workflow.
Practice with stock, futures, forex, and options simulators, including replay-style and backtesting features referenced on the site.
Monitor options flow, screen for flow trends, and compare options activity with performance using specialized analysis tools.
Use TradesViz as a central trade journal to import executions, add notes, and review results across different asset classes in one dashboard.
Use the AI Q&A and statistical dashboards to ask questions about performance, summarize patterns, and identify recurring mistakes or edge cases.
Use the simulator, replay, and backtesting tools to test ideas or practice execution without risking capital.
Use planning, goals, calendars, and day views to track setups, targets, and routine behaviors around each trading session.
TradesViz imports trades from broker files, broker sync, and manual trade entry. The import guide says the platform only imports trading transactions, while deposits, withdrawals, and other account-based transactions are handled separately in the dashboard.
The pricing page lists multiple plans, including a free Basic plan and paid Pro and Platinum plans. It also shows a 7-day free trial for the paid tiers and a monthly or yearly billing option.
TradesViz is built for individual traders managing their own journal, analytics, and simulation workflow. The source material does not provide evidence for multi-user team collaboration features beyond account sharing settings.
Supported coverage shown on the site includes U.S., Canada, India, and Australia, plus global indices, forex, cryptocurrency, and several broker/platform integrations. The broker list and pricing pages indicate support varies by plan and by asset class.
Les données de trafic sont fournies à titre indicatif uniquement.

Hurree is an AI-powered reporting and analytics platform that centralizes company data, shared dashboards, and Riva summaries, recommendations, and forecasts.

北极九章 is an enterprise AI data insight engine for natural-language data analysis. Ask by typing or voice and get charted results in workflows.

Postfity is a social media management tool for scheduling, planning, publishing, and tracking posts across connected accounts. Includes analytics, inbox management, AI tools, team workflows, and Free and paid plans.

AnyClip is a visual intelligence platform for video that automates enrichment, improves discovery, and supports engagement and monetization.

Arcwise is an AI product for detecting meaningful metric changes and explaining them with data-grounded analysis. It turns warehouse and business-context data into decision-ready reports in app, docs, or slides.

Finlo is a web-based stock portfolio platform with curated, strategy-based portfolios, monthly updates, and premium research tools for long-term investors.