

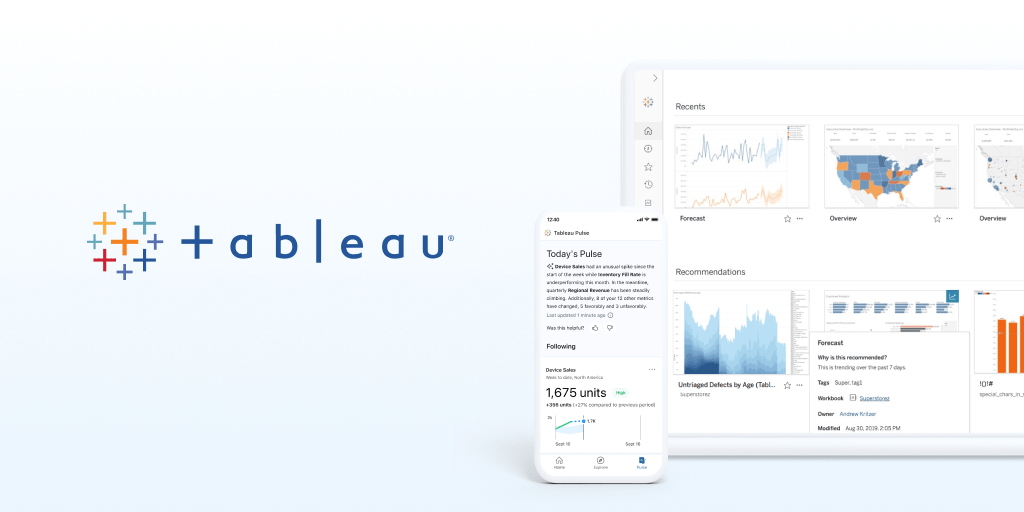
Visual analytics authoring
Connect to data sources and build visualizations with drag-and-drop actions, which the site presents as a central Tableau workflow.
Tableau is a business intelligence and visual analytics platform designed to help people explore data, create visualizations, and share insights. The site describes it as a market-leading choice for modern business intelligence and positions it as a way for organizations to see, understand, and act on data.
The product portfolio includes Tableau Cloud, Tableau Server, Tableau Next, and Tableau Desktop. Across those options, Tableau supports hosted, self-managed, and offline workflows, with governance, data management, collaboration, and AI/ML capabilities available through the platform.
Connect to data sources and build visualizations with drag-and-drop actions, which the site presents as a central Tableau workflow.
Explore, model, and visualize data in Tableau Desktop, including offline work in a governed environment.
Use Tableau Cloud for fully hosted analytics without managing servers or infrastructure.
Run Tableau Server when you need self-hosted analytics on your own infrastructure or in private or public cloud instances.
Use Tableau Next to combine AI, trusted data, modular architecture, and direct workflow integration for insight-to-action workflows.
Share insights securely and collaborate through browser-based web authoring and the broader Tableau platform.
Use Tableau Cloud when a team wants a fully hosted analytics platform to connect to data, build visual analytics, and share insights without managing servers or infrastructure.
Use Tableau Server when an organization needs control over its analytics deployment on its own infrastructure or in private and public cloud environments.
Use Tableau Desktop for flexible data exploration, modeling, and visualization, including offline work when analysts are away from the network.
Use Tableau Next when the goal is to turn trusted insights into actions faster by combining AI, trusted data, modular architecture, and workflow integration.
Use Tableau for organization-wide reporting and collaboration when different roles need to create, consume, and share visual insights through the same platform.
Tableau is a visual analytics platform for exploring, understanding, and sharing data through interactive visualizations. The pricing page shows deployment options across Tableau Cloud, Tableau Server, and Tableau Next.
The pricing page shows Tableau Cloud as fully hosted, Tableau Server as self-managed, and Tableau Next as an open analytics platform with AI, trusted data, modular architecture, and workflow integration.
Tableau pricing is sold as annual contracts billed annually. Tableau Standard starts at $15 USD per user per month billed annually, Tableau Enterprise starts at $35 USD per user per month billed annually, and some premium editions use contact sales pricing.
Tableau is positioned for analysts, data scientists, students, teachers, executives, business users, and organizations that want to explore data, create visualizations, and share insights.
The source pages mention broad data connectivity, drag-and-drop visualization, browser-based web authoring, Tableau Desktop and Prep Builder, Tableau Pulse, governance and data management, collaboration, and AI/ML capabilities.

北极九章是一款企业级AI数据洞察引擎,支持用自然语言进行数据分析。业务人员可通过输入或语音提问,在企业工作流中快速获取图表化结果。

Hurree 是一款 AI 驱动的报表与数据分析平台,可集中管理公司数据,构建共享仪表板,并通过 Riva 生成摘要、建议和预测,适合无需技术设置的团队统一查看报表。

Postfity 是一款社交媒体管理工具,可在已连接账号间进行帖子排程、规划、发布和追踪。支持数据分析、收件箱管理、AI 辅助内容工具及团队协作,并提供免费版和付费套餐。

AnyClip 是面向视频的视觉智能平台,帮助企业自动丰富内容、提升检索发现能力,并支持互动参与与变现,适用于媒体、出版、体育及内部视频流程。

Arcwise 是一款 AI 产品,可检测关键指标变化并用数据支撑的分析解释原因。帮助团队在应用、文档或幻灯片中,将数仓和业务上下文数据转化为可直接决策的报告。

15Five 是一款 AI 驱动的绩效管理平台,面向 HR 团队和管理者,集成评估、员工敬业度调查、目标、薪酬与分析,帮助组织在一个系统中提升绩效、参与度和留任率。