


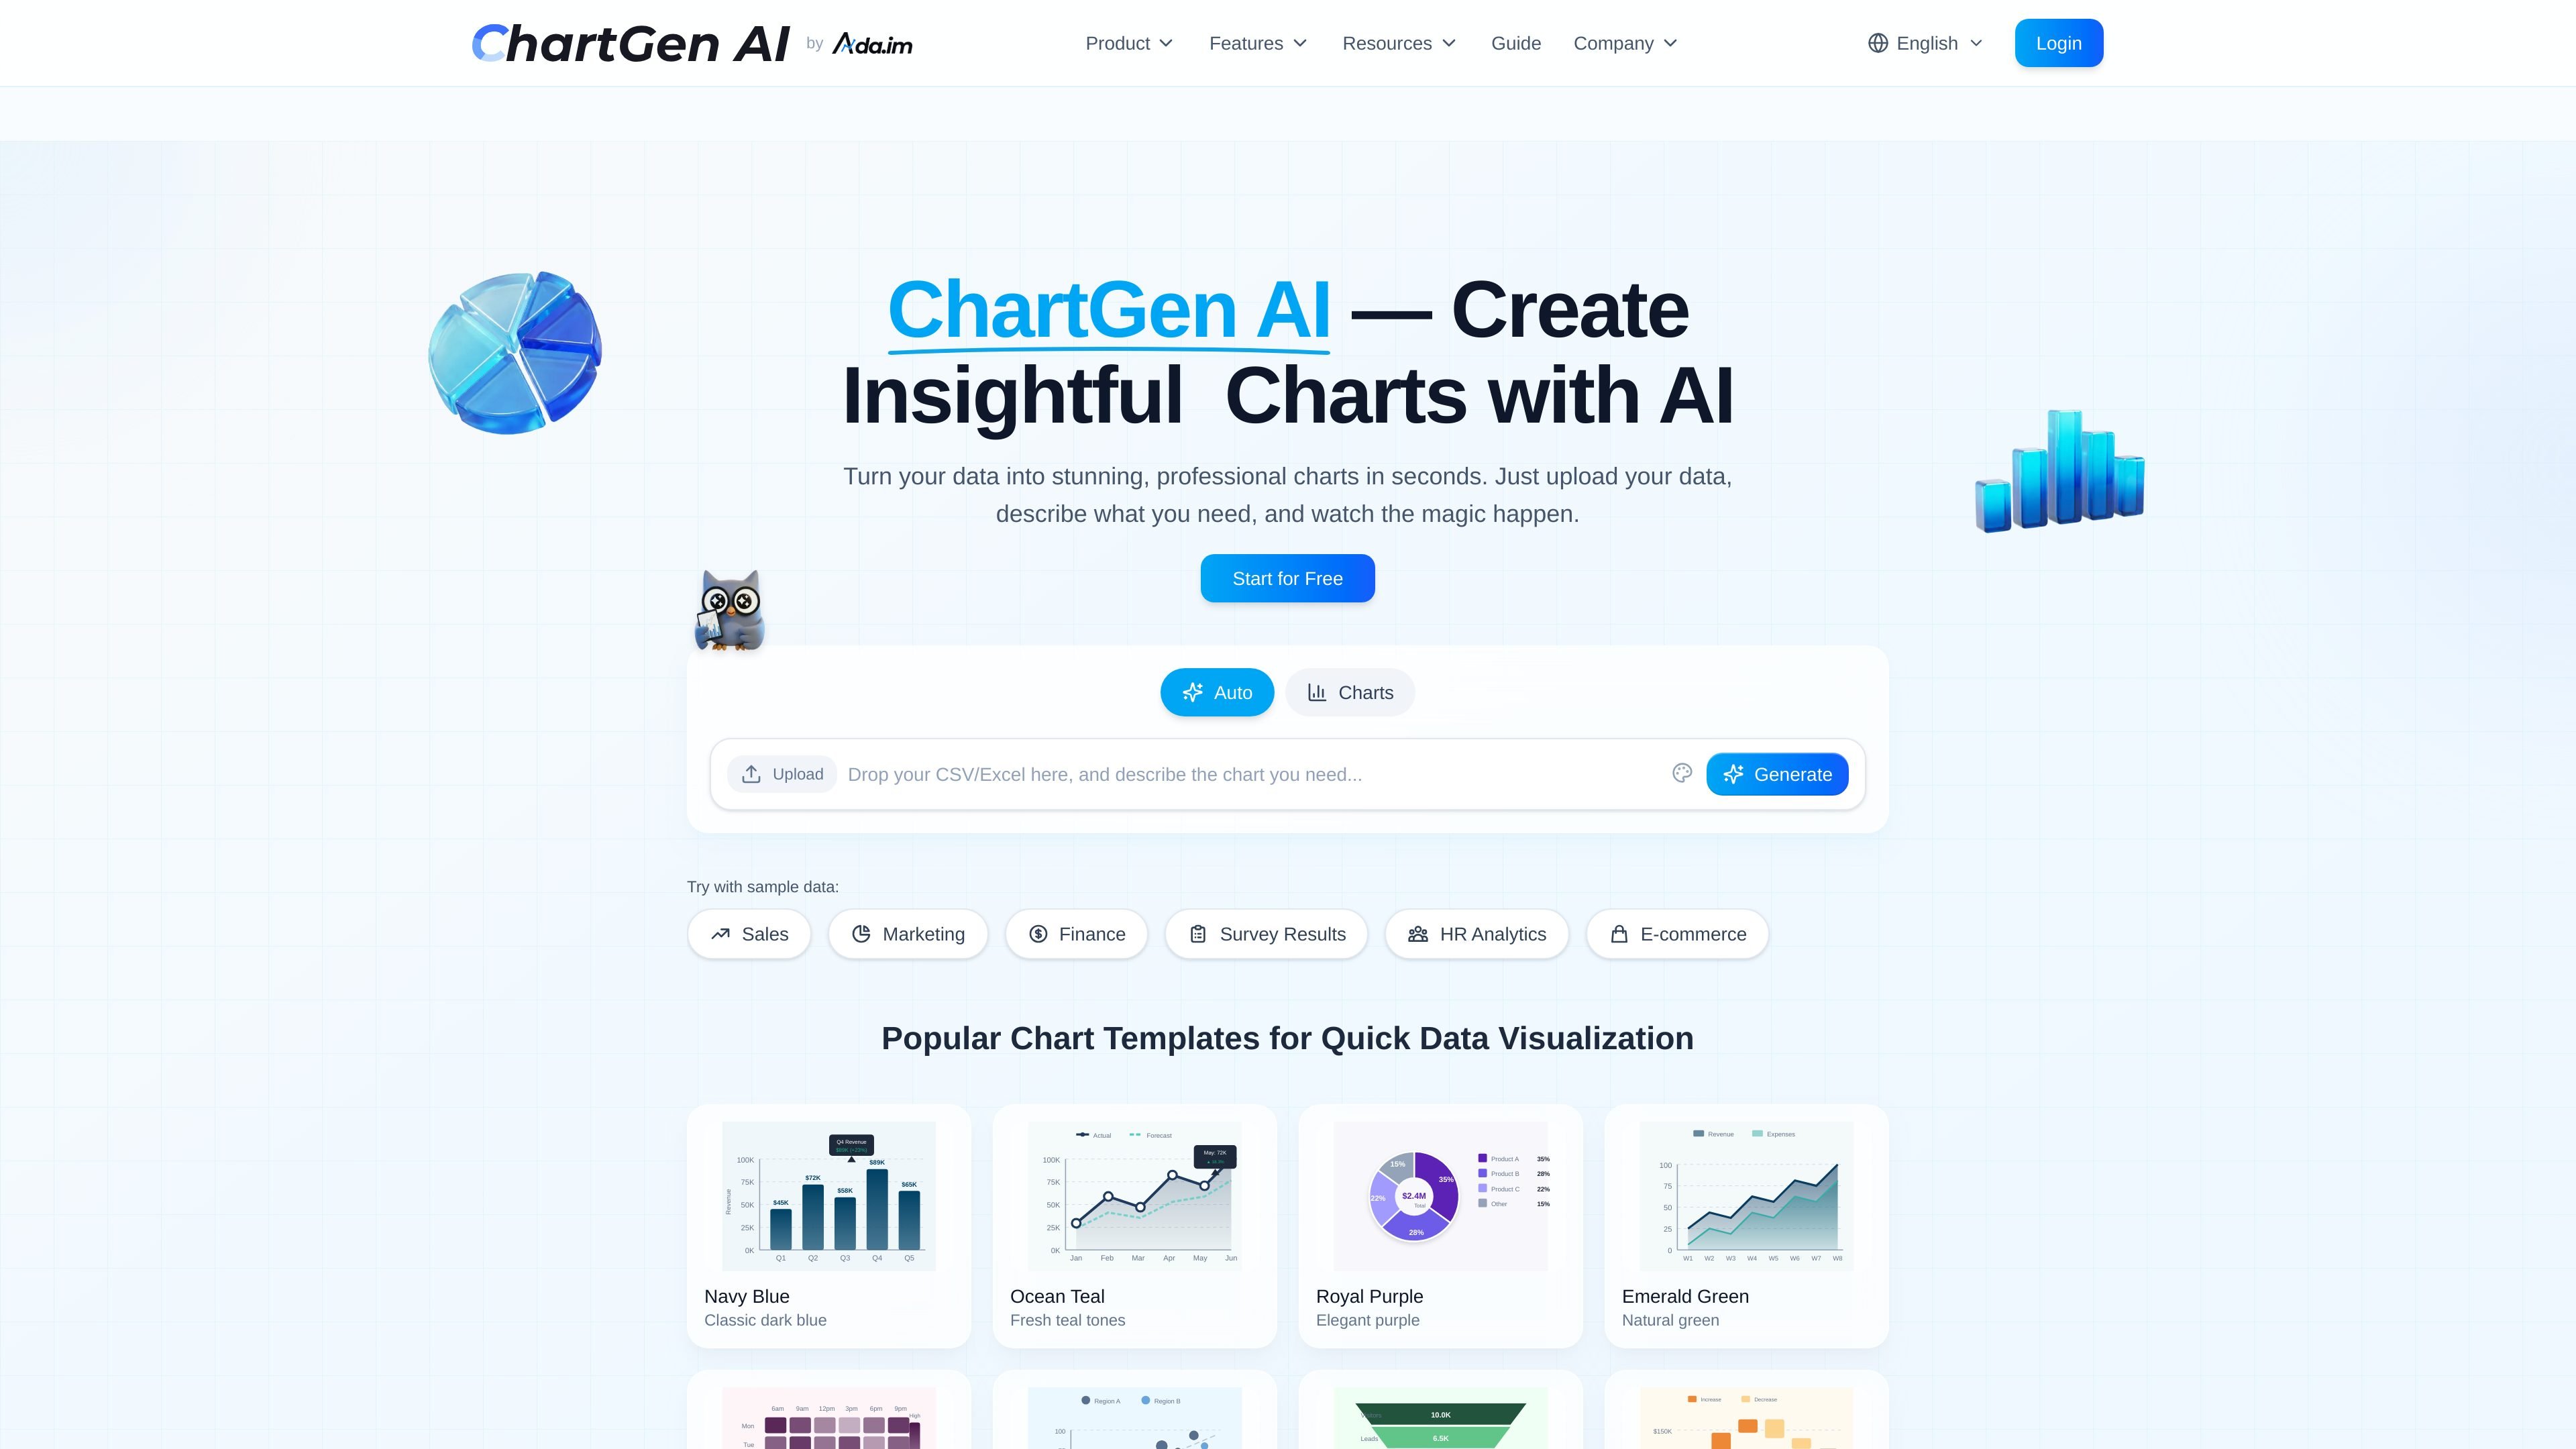
Natural-language chart generation
Upload CSV or Excel files, paste data directly, or connect external data sources, then describe the chart you want in plain English.
ChartGen AI is an AI-powered chart generator for turning spreadsheet data into charts, dashboards, and report-ready visuals. The product is positioned as a free tool that lets users upload data, describe the chart they need in plain English, and generate results quickly without coding or design work.
The source material shows support for common data file types such as CSV and Excel, plus direct data entry and external data connections. It also supports multiple visualization types, export formats including PNG, SVG, and PDF, and template-driven workflows for different industries and use cases.
Upload CSV or Excel files, paste data directly, or connect external data sources, then describe the chart you want in plain English.
Create bar, line, pie, area, scatter, heatmap, combo, waterfall, and funnel charts from the same interface.
The home page says live data synchronization is supported, so charts can refresh when the underlying data changes.
Export charts as PNG, SVG, or PDF for use in presentations, reports, or dashboards.
ChartGen offers 12 color themes and a built-in color picker for customizing chart appearance.
The documentation describes SOC 2 compliance and end-to-end encryption, with data processed in real time and not stored.
Upload sales, finance, or operations data and generate charts for recurring reporting without building visuals manually.
Turn campaign, channel, and conversion data into visual summaries for performance reviews and ROI analysis.
Use templates and sample datasets to build dashboards or charts tailored to industries such as e-commerce, finance, education, retail, and manufacturing.
Create charts for presentations or reports and export them in PNG, SVG, or PDF format for reuse across documents.
Publish generated analysis to dashboards and share it with teammates, stakeholders, or clients.
ChartGen AI is an AI-powered chart generator that turns uploaded CSV or Excel data into charts based on a plain-English prompt. The documentation also says you can paste data directly into the interface or connect to external data sources.
The source material says ChartGen is part of Ada.im, a broader AI-powered data analysis platform. ChartGen focuses on chart generation, while Ada.im includes additional tools such as reports, dashboards, presentations, and team collaboration.
The documentation states that ChartGen supports CSV and Excel files, including .xlsx and .xls. The home page also says you can upload data and describe what you need to generate a chart.
ChartGen supports bar charts, line charts, pie charts, area charts, scatter plots, heatmaps, combo charts, waterfall charts, and funnel charts.
The home page says exported charts can be downloaded as PNG, SVG, or PDF. The use-case library also mentions publishing generated work to dashboards and sharing it with teammates, stakeholders, or clients.

北极九章是一款企业级AI数据洞察引擎,支持用自然语言进行数据分析。业务人员可通过输入或语音提问,在企业工作流中快速获取图表化结果。
ChartAI 是一款基于网页的 AI 工具,可快速生成图表、流程图、信息图及其他视觉内容,适合演示、论文、项目和相关工作流。

响指 HaiSnap 是一款 AI 办公与创作工具,支持用自然语言生成 PPT、报告、数据分析、代码和内容草稿,帮助个人与团队快速交付工作成果。
Tableau is a business intelligence and visual analytics platform that helps people explore data, create visualizations, and share insights. It offers hosted, self-managed, and desktop options for teams that need analytics, governance, and collaboration.

Syft Analytics is an interactive financial reporting tool for businesses, accountants, and non-profits. It focuses on dashboards, consolidations, forecasts, and reports.

AiBiao.com 是一款基于网页的 AI 图表生成器,可通过自然语言、粘贴数据或上传 Excel 快速生成图表,适合演示、文章、教学资料和办公文档使用。